Front end
Architecture
RMT shares a codebase with our parent app, DB Manager. Please look there for full documentation on front-end architecture. Within this environment, RMT uses:
/src
├── components
├── services
├── stores
├── views
Components
Discrete visual elements that are arranged within a view. Some of these may be re-used throughout the app.
Services
Helper functions that handle requests and responses.
├── rmt-api
├── rmtOperations
      ├── caclulateConnectionScoresPerPathway
      ├── caclulateRiskPerDisease
      ├── caclulateRiskScores
rmt-apihandles requests to the back-end APIrmtOperationshandle complex logic to calulate risk scores. This is the same logic as calculating risk scores on the back-end. But for now, it will remain a front-end operation.
Stores
Pinia stores that hold state (data, functions etc.) that will be shared among multiple components. See "Pinia for State Management" section below for more information.
Views
Components that hold an entire page view (containing multiple sub-components). Our only 3 views are:
├── RMT
├── RMTLanding
├── RMTResults
RMTLandingis the landing page for the tool, including background information and a start button.RMTcontains the actual tool, including: country selection, data tables and their keys, and navigation buttons.RMTResultscontains the risk score results, including: results data table and key, data visualizations, and an option to download.
User flow
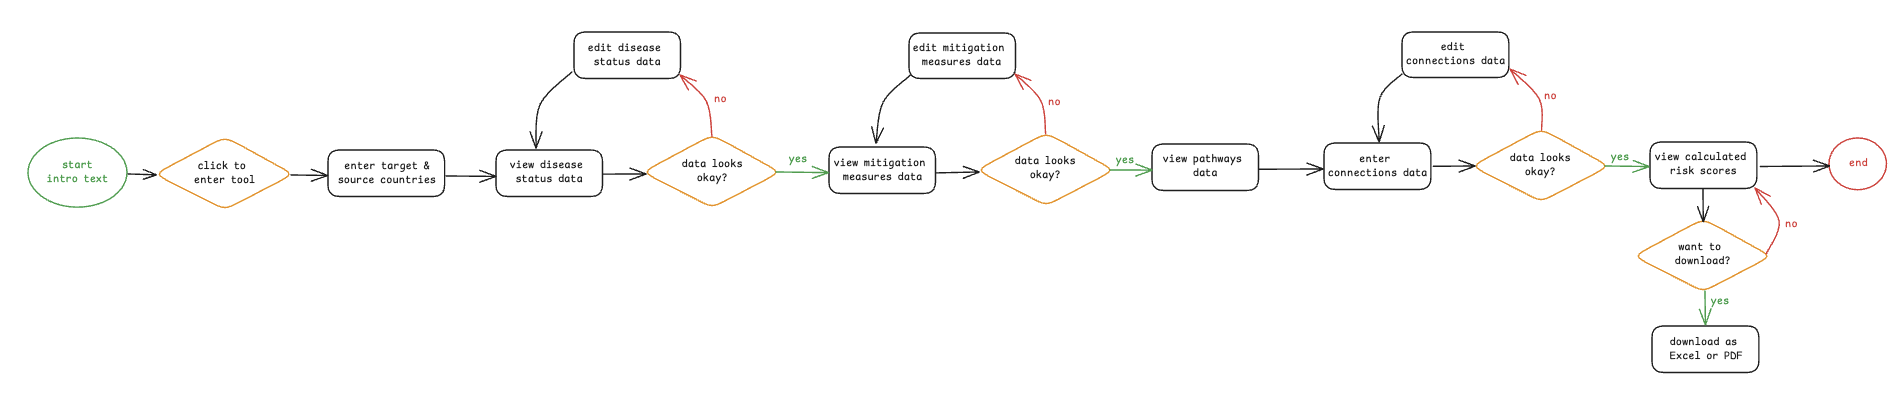
The user:
- Views a description about RMT.
- Clicks to enter the tool.
- Selects their receiver country and source countries.
- Views disease status data for source countries. If the user would like to edit, they: i. Click a button to make scores editable. ii. Edit scores. iii. Save scores.
- Click "Next" to view mitigation measures data for source countries. If the user would like to edit, they: i. Click a button to make scores editable. ii. Edit scores. iii. Save scores.
- Click "Next" to view pathways data. This is not editable.
- Click "Next" to reach connections data entry.
- Must enter connections data for each country, for each field. To do so, they: i. Click a button to make scores editable. ii. Enter scores. iii. Save scores.
- Click "Calculate results" to calculate and view risk score results.
- On the risk score Results view, user may: i. View the risk scores results as a table of data. ii. View data visualizations of the results. iii. Click to download an Excel of the data. iv. Click to download a PDF of the data. This will open a new tab which automatically downloads the PDF.
Style guide
Follow EUFMD's Engineering Guidelines. In addition to those, we do the following:
Vue API
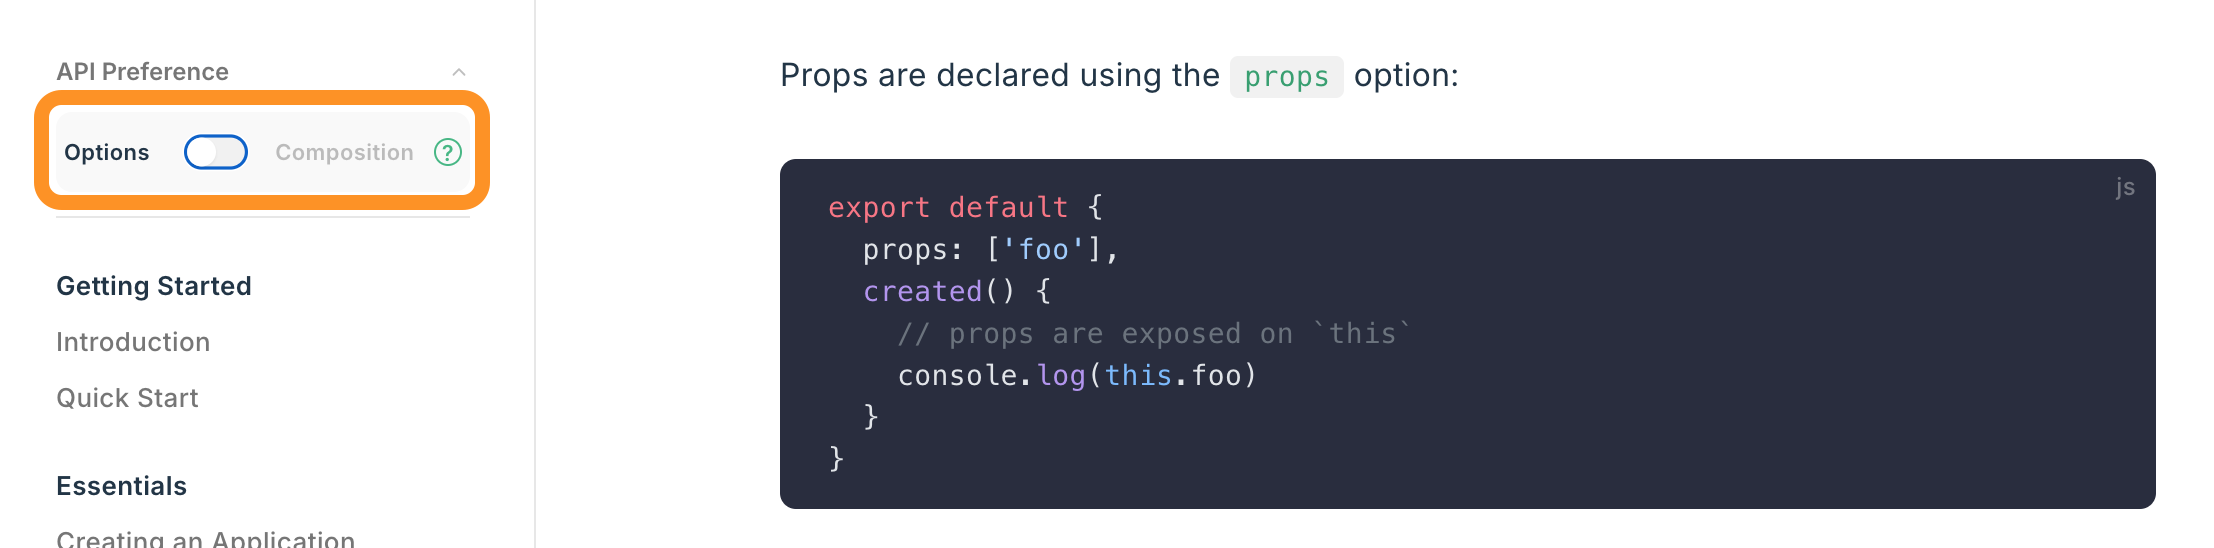
- Use Vue Options API
- There is also the new Composition API, but the original dev team was more familiar with Options format.
- If looking up documentation, make sure the “Options” format is selected:
Naming conventions
- custom events (
$emits) inkebab-case - data/variable names in
camelCase - component names should be:
- in
PascalCase - always multi-word: i.e.
- ❌
Connections.vue - ✅
ConnectionsTable.vue
- ❌
- when components are used by only one parent: prepend with their parent name, i.e. if a Form has components Question and Answers:
- ❌
Question.vueAnswers.vue - ✅
FormQuestion.vue,FormAnswers.vue - This ensures that related components are visually grouped together in the file structure.
- ❌
- when components are reused throughout the app: prepend with
RMT. For example, if we reuse the sameButton:- ❌
Button.vue - ✅
RMTButton.vue - This ensures that reusable components are visually grouped together in the file structure
- ❌
- in
Pinia for state management
Read and follow tutorial here, and examples in client > src > stores.